

In February 2015, the first SpinLab class walked through our doors and began their program with us. It was a great experience for everyone on this day, and a scary one as well. But today, in 2017 we can proudly say we’ve learned a TON about startups and how to best guide them, and we’ve also learned a great deal about running our own team, and the logistics of running a successful business overall.
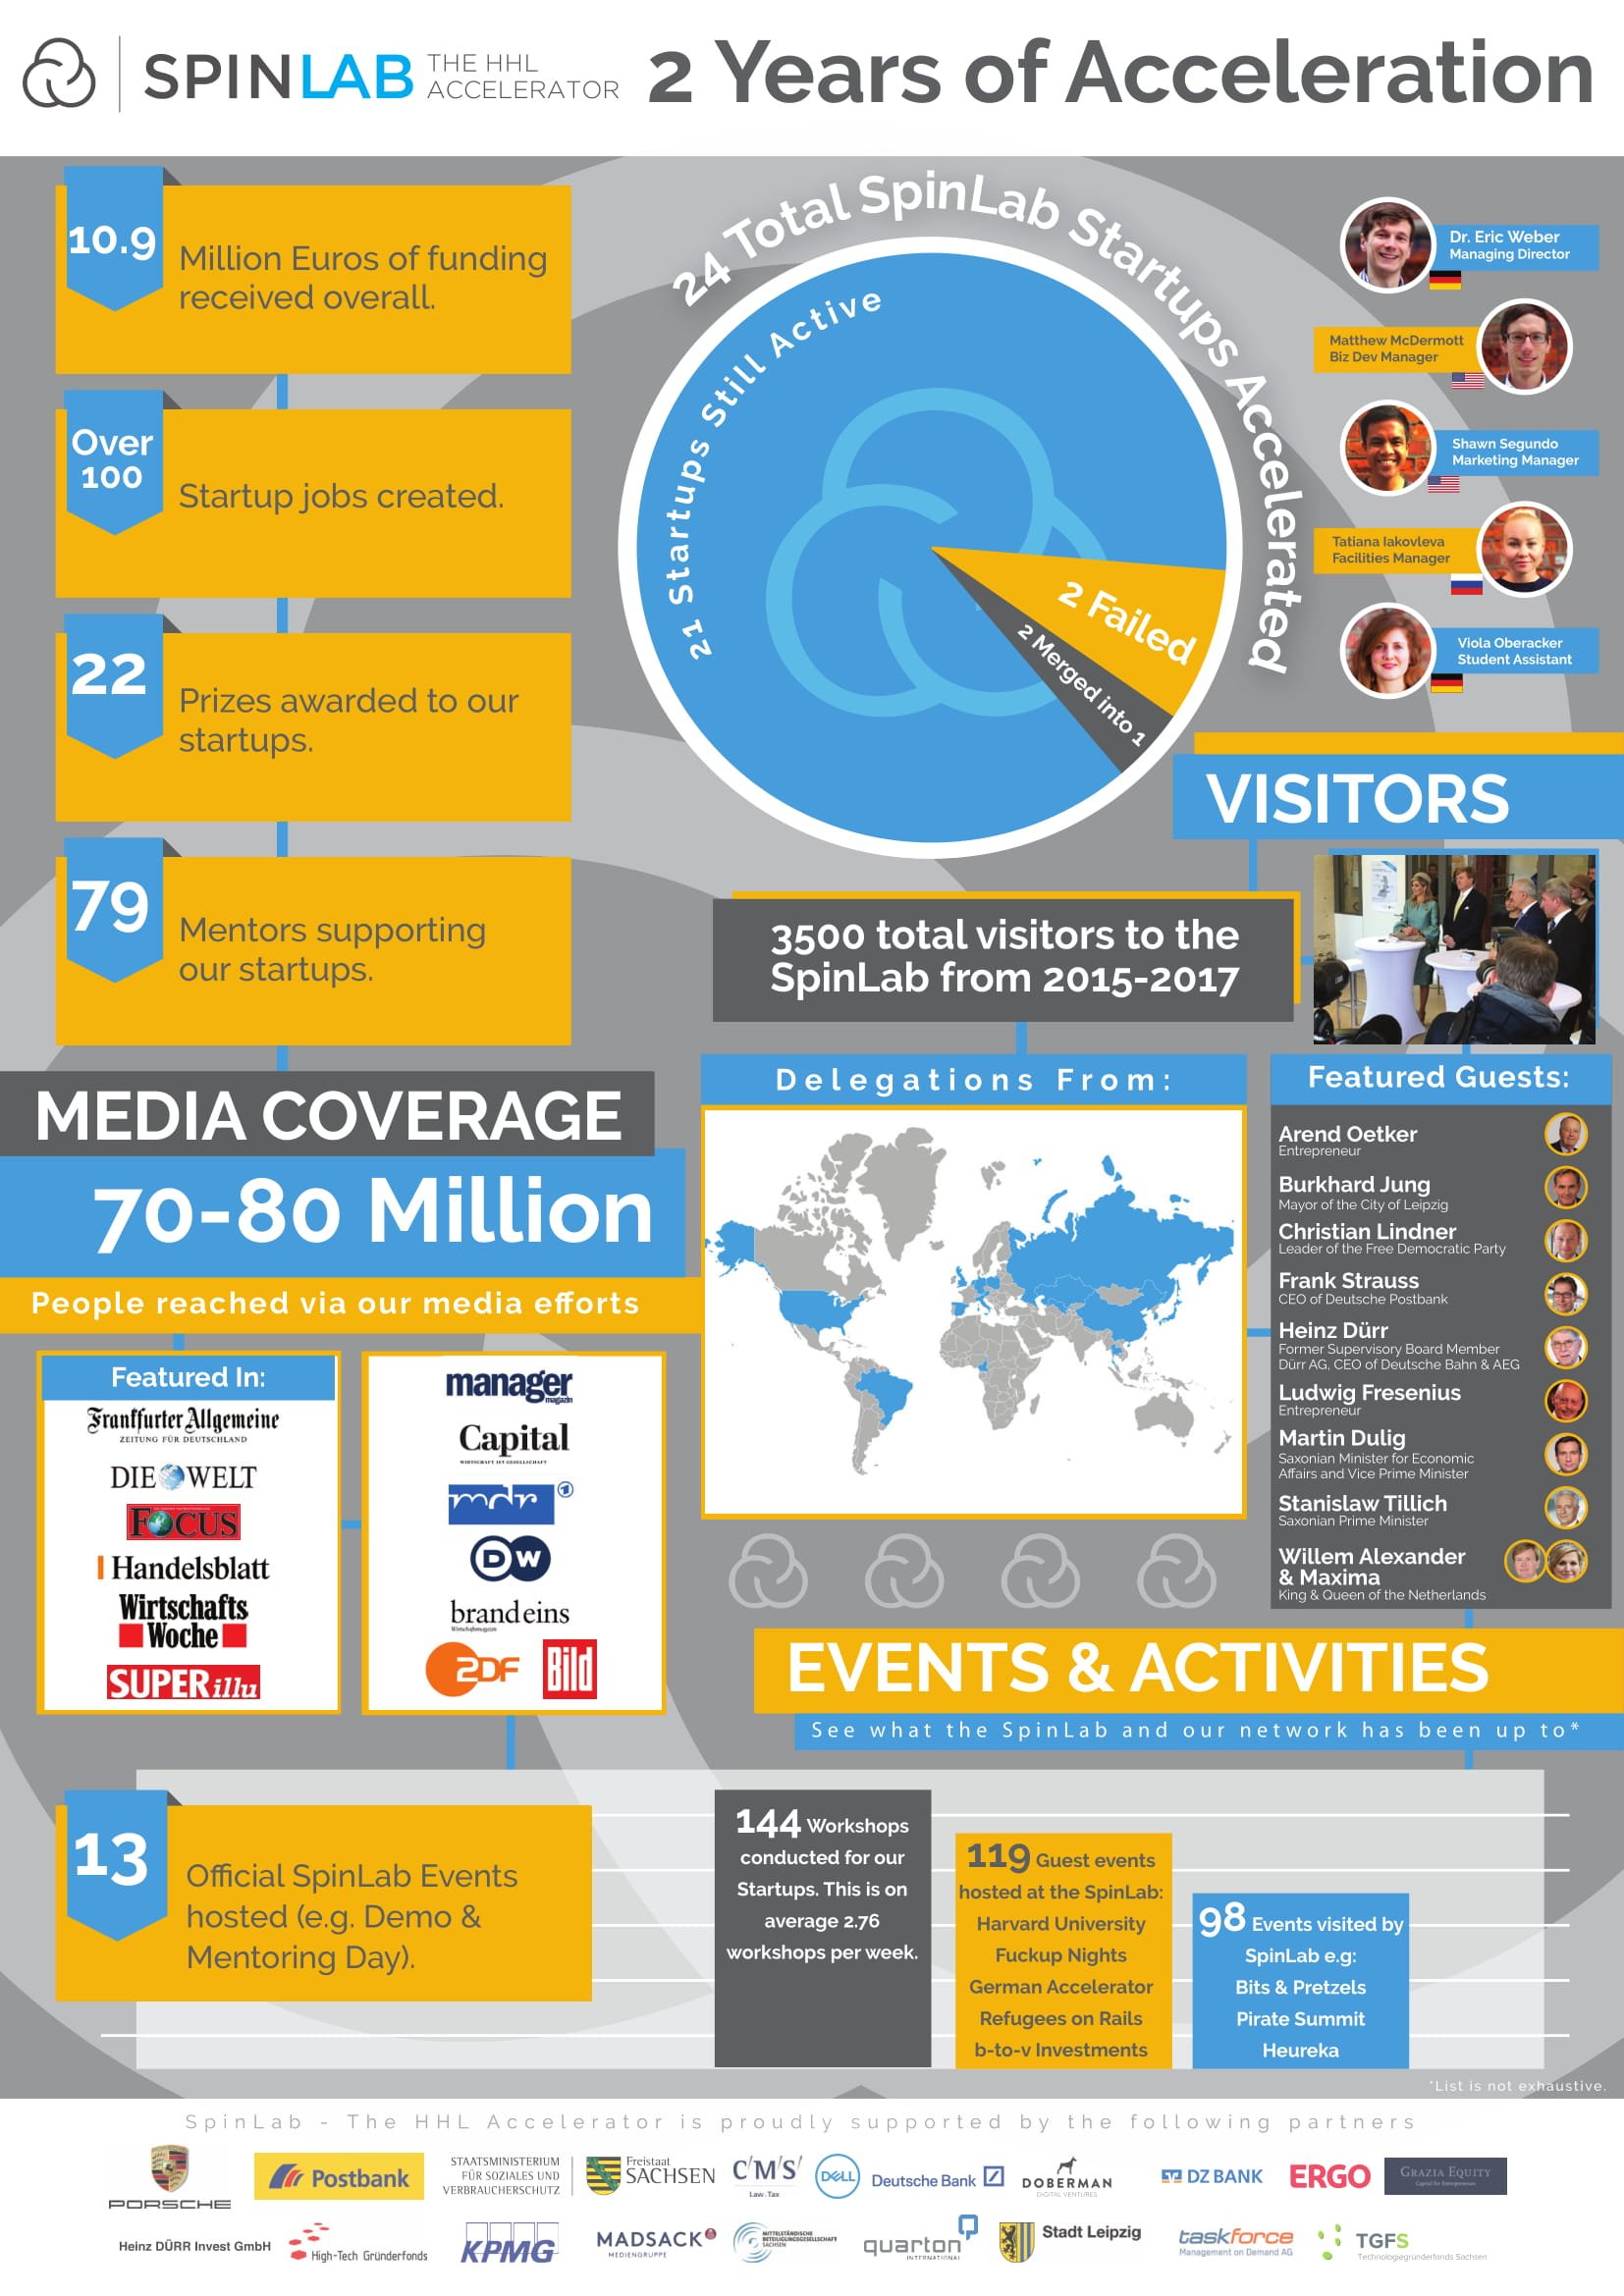
So we wanted to celebrate by creating a new infographic highlighting our key success points and events in the last two years. Some of you may remember a social media post a while back ago where we had a bunch of envelopes packed and ready to go, those were this same infographic sent to people in our partner network, but we also wanted to share it with everyone online.
Infographic-ing is a lot of hard work
An infographic can really be a hard project. Here’s some general tips to consider when you start creating an infographic, that have been successful for me.
- Get your facts straight first. What I mean here is talk to all decision makers in your organization who are interested in the outcome of the infographic, and have them commit to what information they want on the infographic, before you commit to any type of design work. The reason for this is to prevent wasting time. It’s much easier to fix issues such as ”Can we add some fotos here” or “Can you change the color of this section” than it is to correct discrepancies such as ”Oh actually how many cars we sold in 2017 is no longer important, instead we want to talk about how effective our production process is. A change such as this is going to cause you a lot of pain on the design side, and will just end up costing you time. Therefore, before you even begin with the creative process, make sure you’ve got buy in from all important people with what facts need to be on this graphic.
- Start with a pen and paper. Going straight the computer is also going to waste time. Start old school with some quick sketches to get an idea of how your layout will be, and how your company’s branding will come into play. When you have a good feeling about how you want the overall layout to be, then take it to the computer.
- If you know how to use Adobe Illustrator, just build something from scratch. I’ve played around with various infographic templates and free infographic creation services online, and in the amount of time I take researching these guys, trying them, and fiddling around the templates to make them do exactly what I want, is usually longer than it takes me to create a solid template from scratch on Adobe Illustrator. The other benefit is I’ll know all of the ins and outs of the template, and will know exactly how to change anything I need to change. You also get the added benefit of knowing your end product can yield a high quality print worth graphic. The same cannot be said about all online products.
- If you don’t know how to use Adobe Illustrator, then use Canva and Vizzlo. Of the free options out there for infographics and presentations, I like Canvathe most. I find it the easiest tool to use, with good base templates to start. Vizzlo, one of our SpinLumni from class 2, doesn’t make infographics as a whole, but they definitely make some snazzy charts and graphics that you can incorporate into your infographic. See that cool map in the middle of the one I created in this post? Yep, that was all Vizzlo!
- Get at least 5 eyes to look at your final product, especially if you’re going to print. We typically use 3, but after a while all the renditions start to look the same. So use 3 that can view the product from start to finish to find errors and give suggestions. When you have a final product that you’re ready to send to printing, have 2 more people check it that have never seen it before. Embarrassingly enough, the final version we mailed out to people had a small spelling error on it that we failed to catch! If we went with the 5 eyes model, maybe we could have prevented this. (If you can find the error, let us know in the comments :) ).
- Have fun with it. Cliche but true, it will take a lot of time to do it right, but in the end, you’ll have something cool you can be happy to share with the world.


/White%20Versions/stadt_leipzig_white.png?width=130&name=stadt_leipzig_white.png)
/lfca_white.png?width=119&name=lfca_white.png)

/White%20Versions/sachsen_signet_white.png?width=65&height=79&name=sachsen_signet_white.png)