

So to change things up a bit, I’ve decided to shift to a bit of a mini-series that kinda grows with time, and expands as new knowledge continues to be gained. I plan on this to be a living breathing article of the best tips we find whilst working with startups and their Analytics platforms.
Plus, Google Analytics as a whole is a pretty vast world to step into, doesn’t really matter if you’re a startup or not, if you don’t know what you’re doing, or even more importantly, why you’re doing it then you can end up wasting quite some time in reports and areas of the product that you just don’t need to be messing around with. So I’m going to break it down into random segments of knowledge here and there in this series of Google Analytics articles. Hopefully you’ll find them useful in the times to come.
Table of Contents (as a reminder, each section is specific to Google Analytics):
- Startups should be setting goals in Google Analytics
- If your startup isn't tracking buttons in Google Analytics, you're doing it wrong
- The massive reach of SPAM can effect Google Analytics as well
- WTF is up with common errors in Google Analytics
- Save time in Google Analytics, meet the shortcuts feature
- How scroll tracking in Google Analytics can help you out
Goals in Google Analytics. Why you absolutely must start here.
Ok let’s get right down to business, setting up proper goals in Google Analytics is the single most important thing you need to do right now if you’re using it. So I guess in theory the most important thing to be doing would actually be to first and foremost use Google Analytics, and then make sure you’re tracking goals. :)
"Setting up proper goals in Google Analytics is the single most important thing you need to do right now if you’re using it.”
Yep. Before we even touch the surface of the interface of Google Analytics, or slick reports, or talk about how Google Tag Manager comes into the picture, you need to stop right here and ask yourself the question: What do I want my users on the site to do?
Until you know the answer to this question, don’t bother doing anything else inside of Google Analytics. Break out the pen and paper if you have to, but figure this out. Remember, business needs first, going to the user interface second. Here’s some general ideas to get you started:
- How much money does your site need to make?
- What forms do you need to monitor on your website?
- What flows / user paths do you intend for your users to follow on your site?
- Define what conversion rates are important to you as a business.
- Have other touch points such as a blog? How important are these to you?
- What parts of your website are the most important to you? (Site hierarchy).
That should get some of your brain juices jiving. But really, figure this out first and make the goals great. Only then can you move on to the next phases.
How does a startup setup goals in Google Analytics?
If you run a Google query on ”Setting up goals in Google Analytics” you’ll be overwhelmed by the results. I’m not here to re-write anything that’s already been done outstandingly, so generally there are two people I recommend for these guides:
- Perfecting your goals in Google Analytics by Yoast. If your site is hosted on Wordpress, chances are you’ve heard of Yoast. They’re pretty much the kings of SEO in Wordpress, and they update contact regularly. This guide will give you some knowledge on proper goal formulation, and also how to implement them in the interface itself.
- 4 Google Analytics Goal Types That Are Critical To Your Business by Kissmetrics. Kissmetrics also puts out a ton of great content, and this one will emphasize the goal types in Google Analytics. (We’ll touch more on that later).
- Setting Goals in Google Analytics - A Video Guide. This is a nice little video walk through written by David over at theppcmachine.co.uk. It's a well put together 4 minute walkthrough for those who prefer video content.
There you have it startup lovers, let’s go back to the basics on this one and keep it simple for the first step. Get those goals in order, now keep reading on to expand your knowledge.
Button Tracking. Opening up a whole other dimension of things you can track in Google Analytics.
Yeah yeahhhhh I can already here some readers out there scratching their heads and wondering what I’m about to be getting at here. “Button Tracking? First off, what does he mean by that, and second off, why should I really care?”
Ok, well first and foremost, let me just say that buttons are basically the driving force behind your website.
"Let me just say that buttons are basically the driving force behind your website.”
Yeah. I said it. But seriously, think about it. Buttons drive everything you want your prospects to be doing. The modern person doesn’t show to a website that’s all text, then calls the business and resumes the interaction this way.
That just doesn’t happen. We’re flooded in a world of try now’s, sign up’s, register today’s, but now’s, and so on and so forth. We want users to click buttons because that gets them to further interact with our organizations in some capacity.
Buttons are all over the place, and their sole purpose in life is to get you to click them. So all in all, your buttons need to do their job, but how can you actually be sure that they are succeeding and their task?
Let’s take a look at what a scenario looks like when you don’t track button performance.
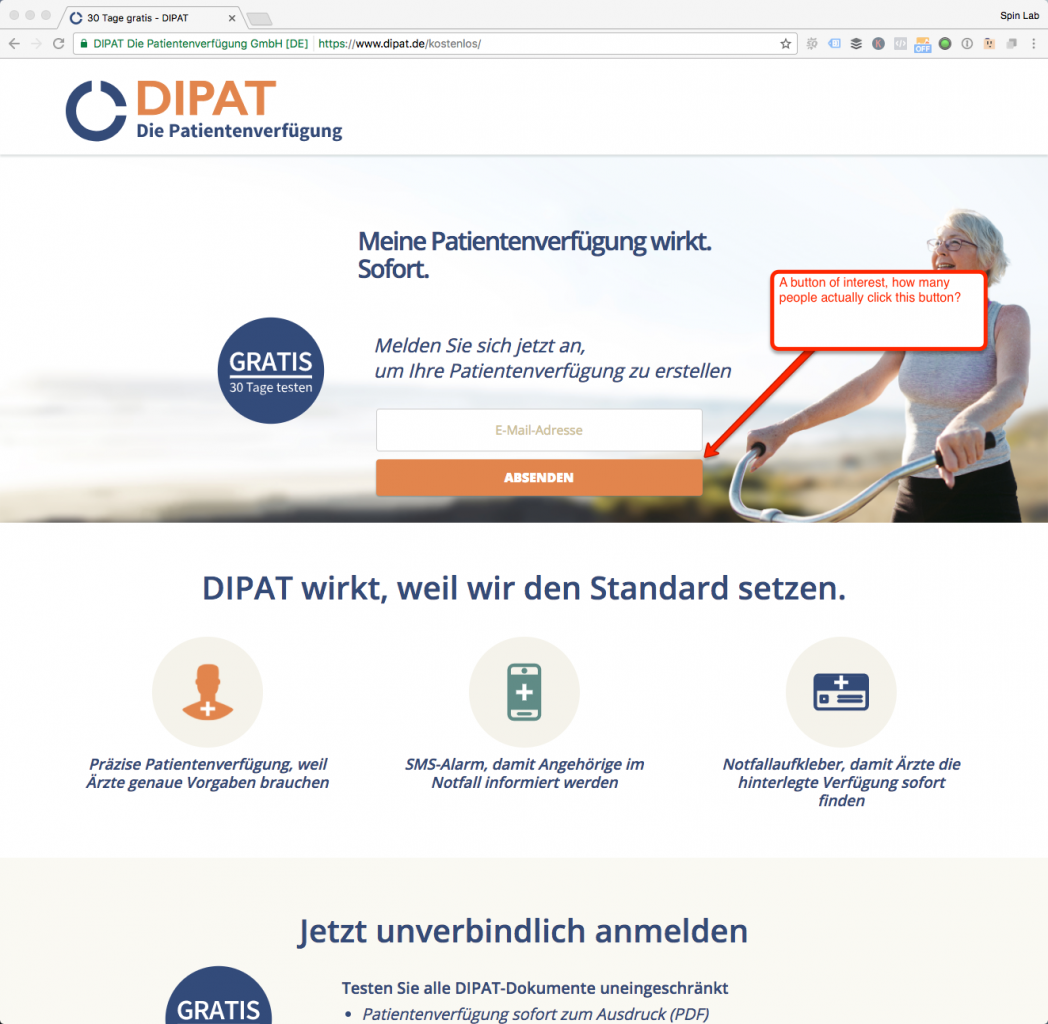
If you click on the image above, or simply visit https://www.dipat.de/kostenlos/ you’ll see an example of a landing page (LP) from class 4 SpinLumni, DIPAT, which is currently live. For those unfamiliar with DIPAT, they make an electronic Patientenverfügung, for our non-German speaking friends, a Patientenverfügung is a living will.
DIPAT has made some great progress with their product and customer base in a short amount of time, and in recent times they’ve rolled out a 30 day totally free offer. This is the offer being highlighted in the landing page we’re going to be looking at. As the screenshot describes, DIPAT should be extremely interested in three key factors regarding this LP:
- How many people got to this landing page (and from where).
- Of those people, how many of them clicked the “absenden” (register/send) button.
- Of the people that clicked the button, how many of them completed or took the offer. (In our example, the people who click take additional steps after clicking “absenden” before they really have the 30 day living will.
Here’s the thing, without tracking the button clicks, all the information DIPAT has is how many people landed on that URL (automatically done if Google Analytics is installed) and how many people get all the way to the end of the process and take advantage of the 30 day free trial. That is certainly a conversion rage (basically number of free trial sign ups / page sessions) but not a very accurate one.
Why? Because the button is the gatekeeper of the offer. Let’s say DIPAT one month gets 1000 sessions to the LP, and gets 10 full sign ups of the 30 day free trial. 10/1000 gives us a 1% overall conversion rate (CR). Maybe DIPAT is happy with this number, maybe they’re not. But we’re missing that key bridge with the button….
Now let’s imagine button tracking is installed with the same metrics, 1000 LP visitors / 10 completed conversions, but now let’s imagine of the 1000 LP visitors 850 of them clicked the button. Now we have two key, separate, conversion rates to look at:
- 850 Button Clicks / 1000 Overall Sessions = 85% CR Sessions to Button Clicks.
- Now we know that only 850 people had a chance to complete the application for the 30 day free trial. 10 Full Trials / 850 = 1.2% CR
Now revisit this information. First we know there is a serious disparity on the 2nd half of the buyer’s journey.
A massive 85% page visit to button click CR, but that number significantly drops between button clicks to actual trial registrations. That is an immediate indicator to DIPAT that the 2nd half of the process is too uninteresting / hard / un-engaging / confusing / whatever to the prospects, and it should be investigated. Secondly, it’s more accurate.
Without the button tracking, the original conversion rate of 1% is inaccurate, because we’re factoring in the total amount of page visitors, but in reality not all of them had the chance to go through the whole process as some of them left the page without clicking the button.
Ok, the strategy behind this may be sounding kind of confusing with just words, so is a funnel picture that may help clarify some of this: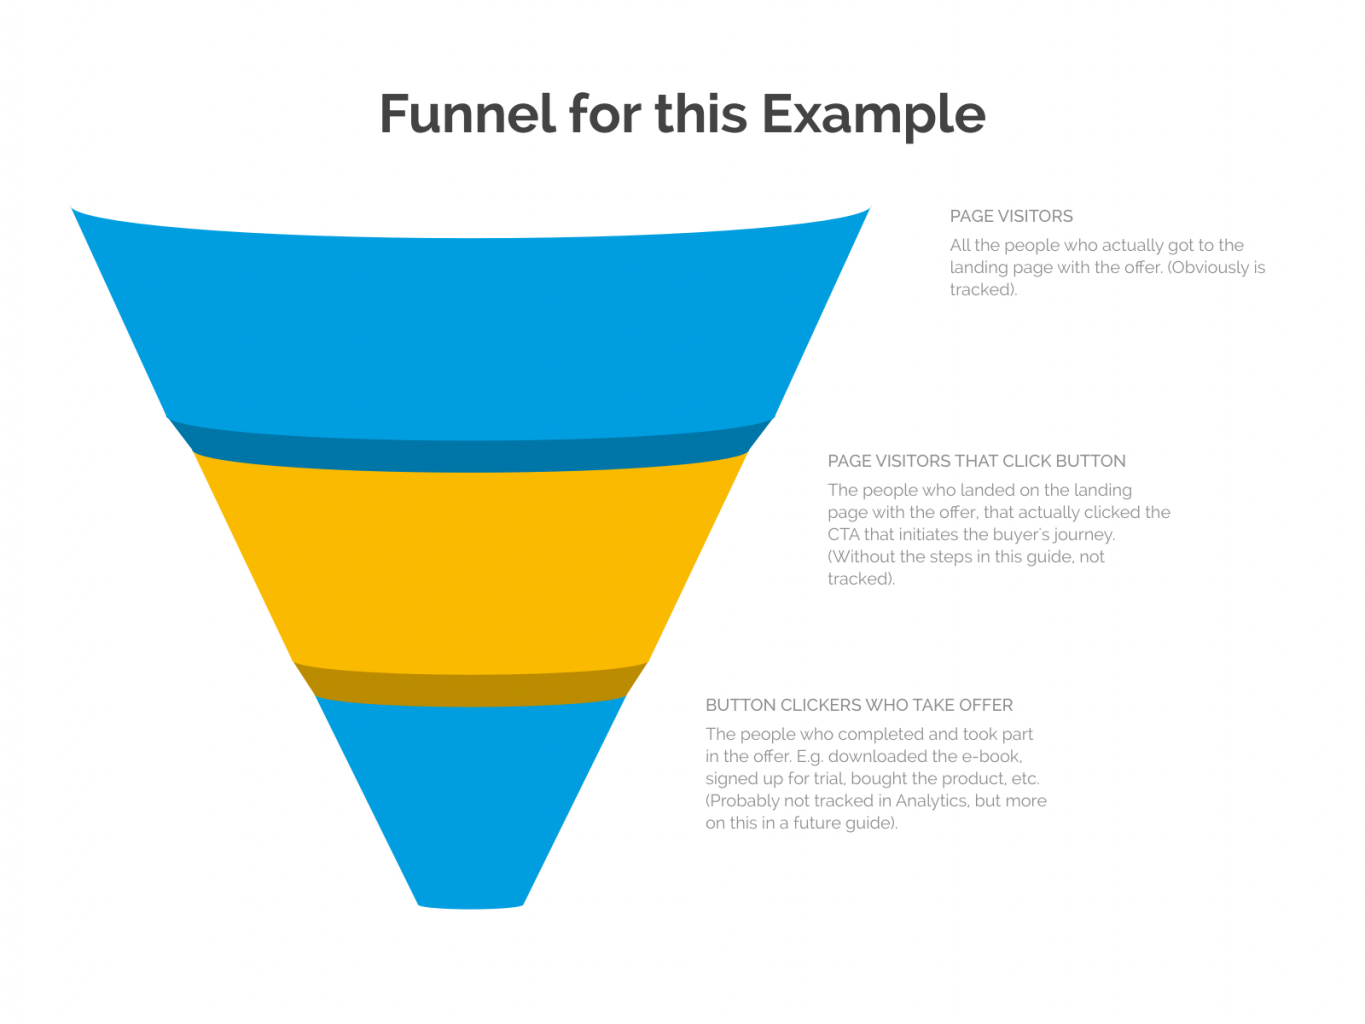
If you’re still confused, just trust me that you need this, and keep reading on in this guide to figure out how to implement button tracking. DISCLAIMER: There are some instances where this may not work.
Naturally, every site is different and there are some instances were these steps may not work out for you, that being said my personal success rate with these steps is somewhere in the high 90’s percentile. :)
Free Google Tools can certainly help startups out.
I’m all about knowing what’s going on on a website. I’m even more all about knowing what’s going on on a website if I can do so for free. Everything I’m going to show you in this guide will not bring any additional costs to your startups, it will just take some time for you to get familiar with some interfaces, and also getting familiar with recognizing some basic web code. Before proceeding, you should:
- Have a basic understanding of Google Analytics & Google Tag Manager. This means your startup should also be using Google Tag Manager to host Google Analytics.
- A basic understanding of HTML.
Got it? Great. Let’s move on to technical stuff.
Finding out how to isolate and uniquely identify your button.
Every button on every website is unique. It’s your job to find out how the button you want to track is unique, so that we can tell our tools to monitor it. So we’ve got to use the dev tools of your browser a bit to find this information. For our example here, we’ll be using Chrome, but the steps should be somewhat similar for every browser.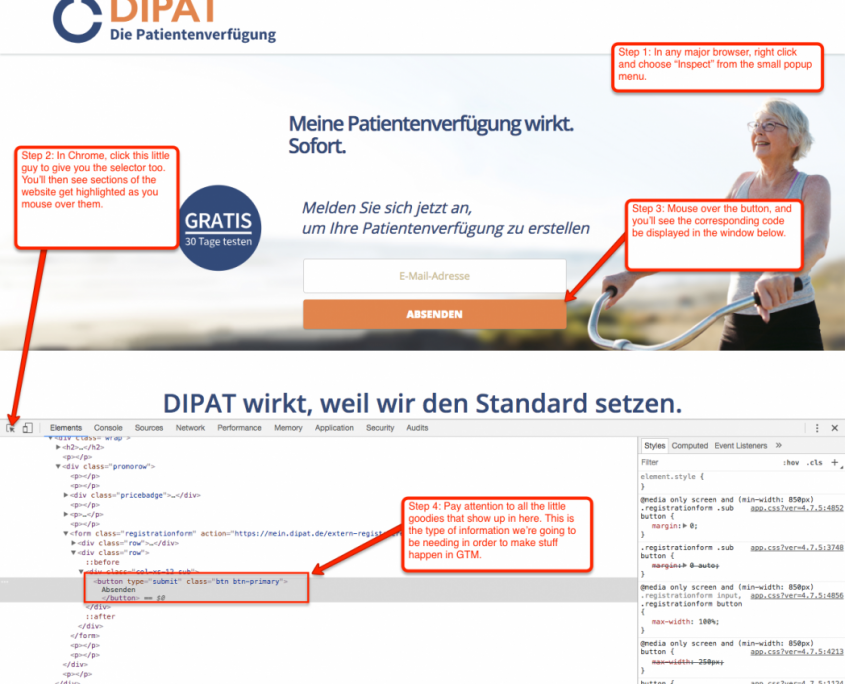
- Go to the landing page you’re interested in. If you like, you can even go through these exact steps on our DIPAT page we’re using as an example.
- Right click anywhere on the page, and choose “Inspect.”
- You’ll see the page start doing weird things as you move your mouse around, it will seem as if it is trying to highlight parts of the page. Move your mouse over the button of interest, and you should see the corresponding code display below.
- Pay attention to this window where the code is showing. In our example, we see button type and class. You may see other options on your own site such as click ID, target, text, etc. All of this information can be useful.
In our example, my focus is on the URL of the landing page and the class of the button. For this example, the class is designated in quotes, so I’m looking at btn btn-primary.
That’s it for this step, just be sure to keep this information on the button we have just found. If you’re really lost on using the developer tools to find this information, take a step back, and check out this beginner’s guide to devtools in Chrome.
Setting up a new Universal Analytics tag in GTM
We’ll need to setup a new event-based Universal Analytics Tag in GTM. I’m not going to go through the details of setting up the Tag, as your level of knowledge should already be there. But just in case you need a refresher, or if you are a total beginner and still want to push your learning, you can see the official Google guide on setting up Google Analytics tags in GTM.
Remember, this needs to be event based, and the values you populate in Event Tracking Parameters should be something specific to your end goal. Here’s how mine looks in the DIPAT example: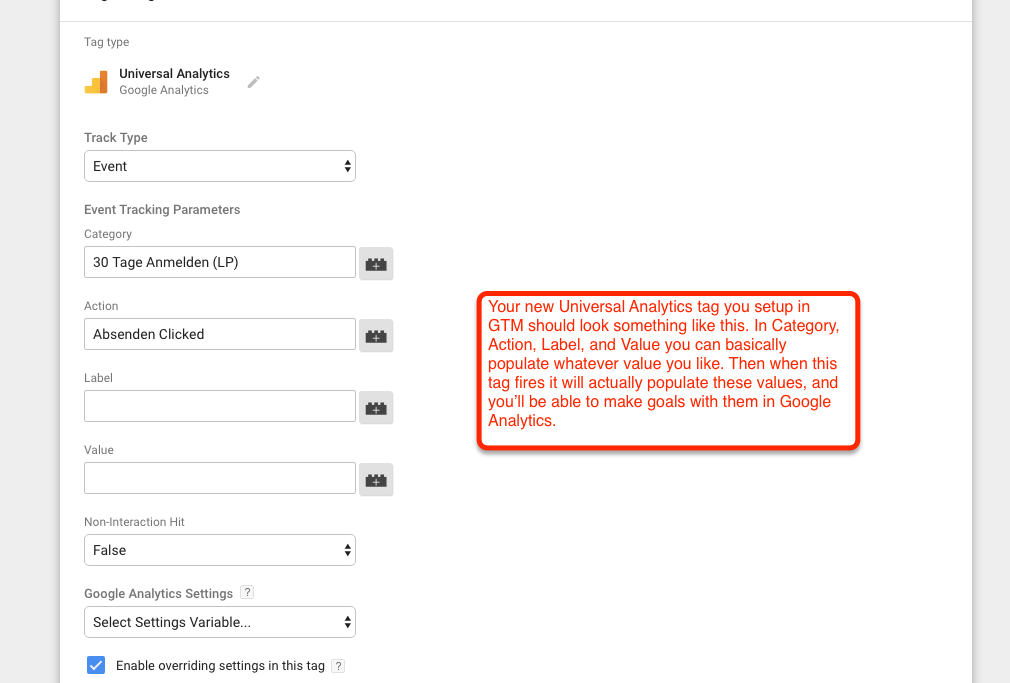
Making sure the tag only fires on the right button.
The trigger is very important, as we want to make sure this tag is only firing on the specific button we want it to fire on. So make sure you know how to set up a GTM trigger, and your setup for the trigger should mirror this (choose trigger type Click - All Elements, with this “some clicks” radial selected):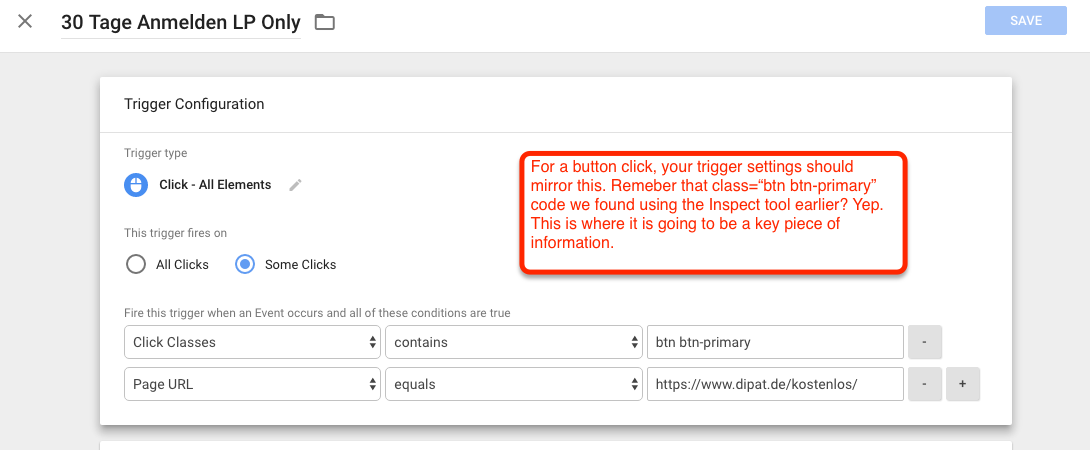
Yep, remember that btn btn-primary class we found earlier? That little bad boy is now about to play a really big role. I’m basically telling GTM to only fire this tage on the URL https://www.dipat.de/kostenlos/ when something is clicked with the class btn btn-primary BAM total isolation! Now I know that the tag will only be fired on that specific button, and no where else on the site.
We really want to ensure this because first off, we don’t random goal hits being collected where they should not be, and secondly we don’t want unnecessary scripts firing where they are not needed as this increases page load time. In my example it was quite easy to isolate, as there was only one button, but you may have a page with multiple buttons where only one is of interest.
You’ll have to play with the combinations available in the trigger settings and with your devtools inspector to see how you can further isolate certain buttons. Worst case, connect with your dev team to see if they can implement some sort of unique identifier on the button you’re trying to track.
Make sure all the GTM stuff is doing what you want it to.
GTM has a great preview mode that allows users to see what their changes will do on their websites, before you actually take those changes live. You should be using this often to debug, and if you aren’t and need to learn how to, check out the official Google guide to GTM debugging and preview.
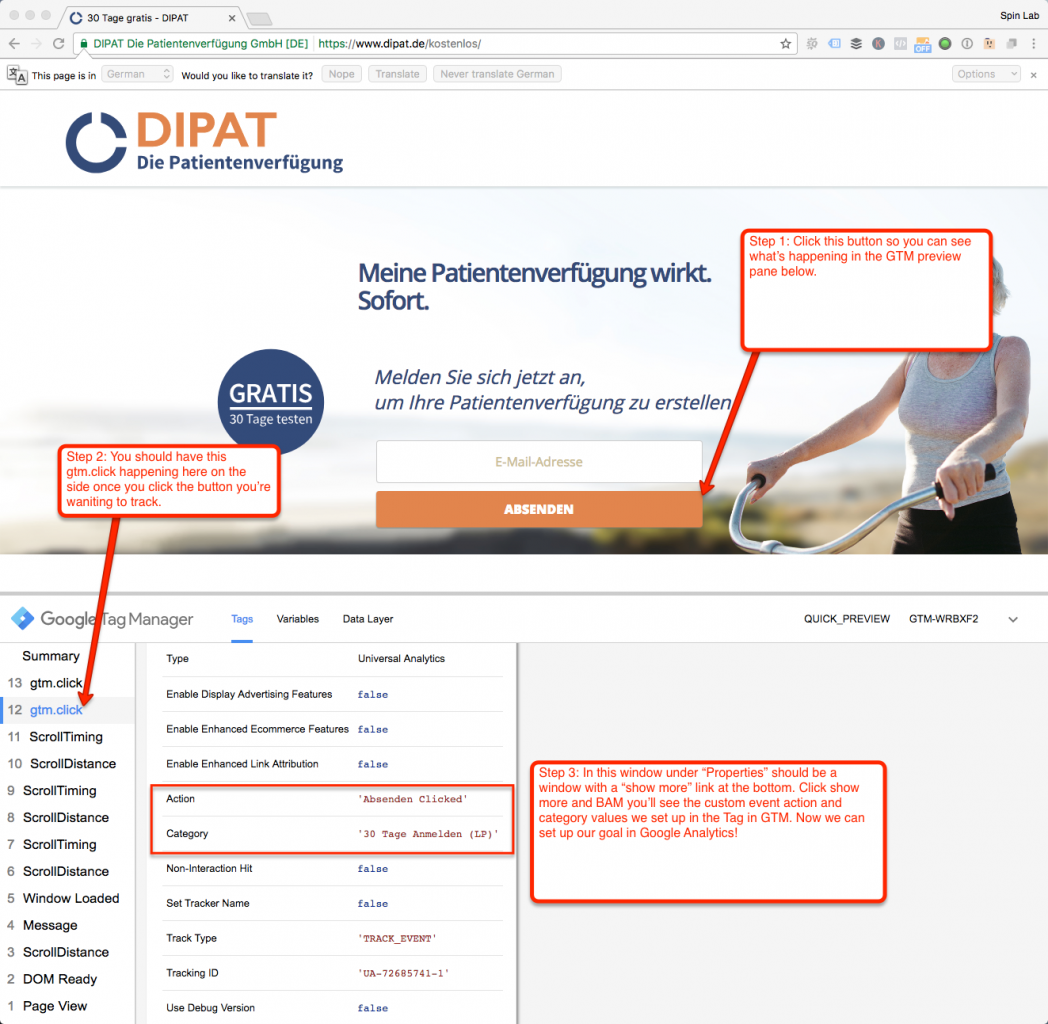
Get your site and GTM configuration into preview mode, and refresh the landing page so the little debugging panel shows up at the bottom, and take the following steps:
- Click on the button you’re trying to track.
- Once you click the button, on the far left side will be a “summary” column. Upon button click a gtm.click item should appear. Click on it.
- To the right you’ll see a “Properties” window, click show more at the bottom and you should see your designated Event Tracking Parameters here.
If that happens, publish the container on GTM to take the changes live. If it doesn’t happen, go back in the steps and make sure you’ve done everything properly up to this point. Keep an eye out for extra spaces, dashes, quotes where they shouldn’t be, etc. The smallest thing overlooked can ruin your entire setup.
Get everything setup as an Event-Based Goal in Google Analytics
Goals are the bread and butter in Google Analytics, I mean ultimately, all the site traffic in the world means nothing to you if that is not somehow increasing your customer base and revenue.
That’s why you should know how to set up a goal in Google Analytics, and you should set up one for this button. Basically, you want the event goal parameters to mirror the same settings that you designated in Google Tag Manager. You can see an example setup of this below: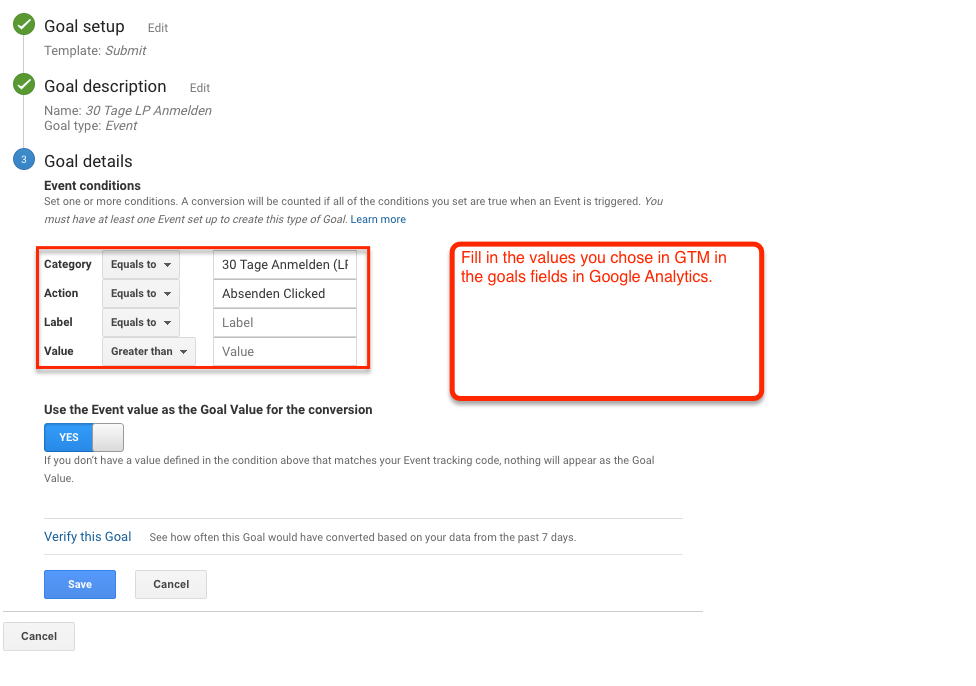
That’s really the last technical setup, if you’ve done everything properly up to now, all you’ve got to do is wait for data to come in so you can begin analyzing it!
My favorite report setup to view in Google Analytics with button clicks
I like to watch goals, especially button clicks, on a page specific level. To get to the specific view I monitor, follow the following steps:
- In Google Analytics, go to Behavior > Site Content > Landing Pages
- Search the name of the page you’re specifically looking for, and click it on the left.
- Above the landing page column, click the dropdown for secondary dimension.
- In the drop down, select acquisition > default channel grouping.
- In the conversions column, make sure the goal you selected for your button is selected, and your done!
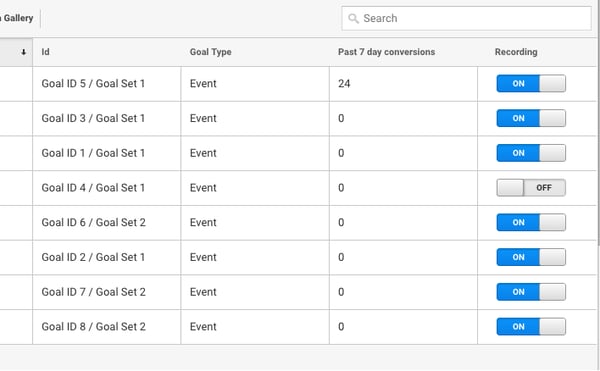
The final report should look something like this: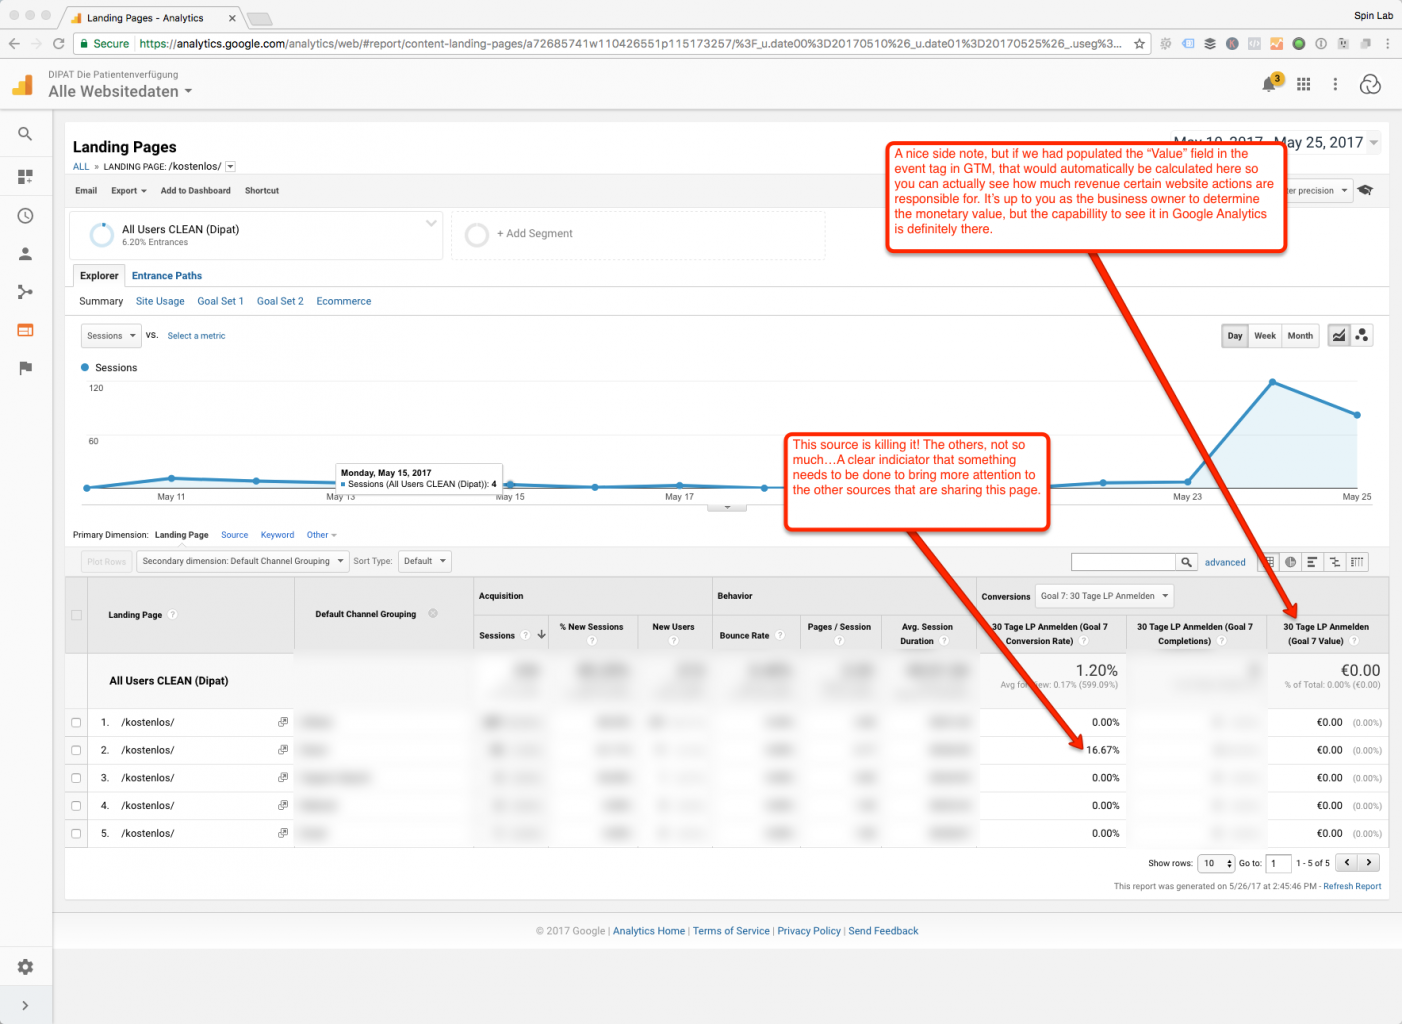
Now I’ve blurred some of their data to not give away all of their information, but here I can basically see what sources are leading to my landing page, AND how well their button performance is on a per-source basis.
This is really powerful reporting, and in our example I can see that source 2 is really doing well, while the other 4 are not yielding me any results. From here I can correlate with my actual 30 day trial submission rate, and I can continue to refine conversion rate further over time.
A nice side note, if you’re a good business manager and you’ve done your research on how much your website offers are worth in monetary terms, you can actually populate that monitor value in the Tag Manger setup phase, and Google Analytics will actually calculate how much money you’re gaining on your site, based on specific activities taken.
That can really help you show your income streams, and in Germany specifically, we know that potential investors love to see proven channels and customers that are already paying!
Wrapping up all this crazy button stuff.
A lot of technical stuff and also strategical stuff happening in this article. Analytics is quite easy to get lost in, but once you get your head wrapped around some very important core concepts, there really is a lot of powerful things you can do.
The guidelines I have established here are basically the foundations for tracking anything on your site more in-depth. This guide will expose you to different types of triggers and tags within GTM that maybe you have not experienced yet.
As I have mentioned in previous articles, GTM is a very powerful tool that is nearly limitless when it comes to tracking on the site, and button tracking is a good way to dive into the basics of this. I hope this helps you get more information from your site, and helps you perform at your best online.
SPAM and what it means to Google Analytics
This week’s article, in similar fashion to the first edition of this series, is going to be short and to the point, but oh so important. Simply put, you need to be using spam filters for your data in Google Analytics.
Who needs to be using these filters? Well, everyone who is using Google Analytics for a website that is running some sort of business.
There’s a lot of great guides out there already on how to do this, so my purpose is not to recreate the wheel, but rather to hopefully be the beacon of hope and reason for any startup out there who may be looking for information on getting started with their site and tracking it properly.
"Who needs to be using these filters? Well, everyone who is using Google Analytics for a website that is running some sort of business.”
Wait, I thought SPAM was just for email?
Now come on, what fun would that be if all those offers to receive gold from African nations were restricted just to the email medium?!
But seriously, spam in your analytics isn’t the same as what it is in your inbox. Rather, there’s tons of ghost bots and spiders out there whose sole purpose in life is to go out and scour the web and various websites for all kinds of random information.
For the most part, their harmless as they can’t result in you clicking some kind of link bait resulting in fraud or identify theft, but they can severely alter your sense of website success. In my experience as a marketing consultant, I’ve seen some websites where over 60% of their actual traffic was coming from spam traffic.
Imagine that, one day finding out more than half of the activity on your website is entirely irrelevant and fake. That’s why it pays to take the necessary steps to prevent spam from even happening in the first place.
Which guide to use?
As mentioned, there’s a lot of data out there already on this concept. Some of it is good, some of it is crap, some of it is just plain outdated, but the guide I pass along to all the startups we take in our cohorts here in the SpinLab is Carlos Escalera’s Ultimate Guide to Blocking and Cleaning Google Analytics Spam and Other Junk Traffic on ohow.com.
There’s a myriad of reasons I like this guide. First and foremost, I will clarify that myself and the SpinLab are in no way affiliated with Carlos or ohow.com, I am simply an avid user and evangelist of his work. So, on to the breakdown…
- Carlos knows what he’s talking about. He’s not a newbie to UX and SEO, he’s quite seasoned in all aspects of online marketing. In fact he’s the founder of ohow.com, and if you simply page through his site a bit, you’ll see that the user experience is quite good, and the content is also to boot. I love paging through here every now and then to see what’s up.
- It’s regularly updated. This is a common problem with how-to guides out there, sometimes you find something great but it’s dated from a couple months or even years ago, so the accuracy of the article comes into question. Those of you not new to SEO know for a fact that Google likes to randomly change things, and even the smallest changes can completely throw a SEO’s game off. Therefore it’s important to stay up to date. This article debuted in March of 2016, and as of writing this article, it was last updated on June 2nd, 2017 (today) and that is freaking awesome. Not only does he update the guide, he also updates common spam sources, so you can also make sure already set implementations are keeping up with new and coming spam threats.
- It’s good for newbies and advanced users alike. You’re welcomed by a very clear and concise table of contents, so for those of us already familiar with Google Analytics we can simply go right to the part that is relevant to us. For those of us dealing with filtering for the first, it’s a very easy read for start to finish.
- The article talks theory and tech. Some how-to guides are too theoretical. Some are way too techy. This guide provides both, so before you dig into the implementation stuff, you get a fairly sound overview on why exactly you should be doing this.
- It’s very detailed. For the implementation parts, Carlos gets very detailed and it’s pretty hard to mess this up. The worded explanations are great, as are the screenshots he includes. You would have to literally try to mess this up, that’s how great this guide is.
- It also deals with historical data. A lot of guides out there walk you through how to prevent future issues, but what if you’ve already been collecting data for a while and there’s a lot of junk in it? Then what? Don’t worry, Carlos has got you covered and has a segmented dedicated to clearing up historical data.
- It’s interactive and offers support. Like any good blog, ohow.com is already equipped with Disqus as a commenting system, and this article already has over 400 comments. The best part, Carlos responds personally to a lot of the queries. I personally have never had to ask anything in his comments section, as the article handles itself so well, but it’s a nice feature for anyone who may need additional support.
Squeaky Clean Google Analytics is on the Horizon!
There you have it my lovely startups, tracking in Google Analytics is of the utmost importance. You need to have an idea of how many people are getting to your online channels, and more importantly, you need to have some sort of indication of who those people are and how they’re behaving on your site.
But that’s just it, you want to learn about that from real bonafide people, not some bot sprawling across the net looking for trouble. So take some time on a weekend, go through the guide, and if you feel confident in your web skills, give it a go and let us know how you did.
If you're wasting too much time clicking around Google Analytics you need shortcuts.
In the last episode of this mini blog series, we covered how you can correct for common errors in Google Analytics.
How’s that been going for you, have you been seeing cleaner data in the last 2 weeks? Was it easy to figure out how to implement a lot of the tactics from that Kissmetrics guide I referred to? Or maybe you started, got some good momentum, and then put it to the side again before you finished, and forgot where you left off…
This leads me to the point I am going to make in this next installment.
Don’t get lost in the Google Analytics Interface
The interface in Google Analytics changes a lot, and it changes pretty often. In fact, they just had a fairly significant user interface about a month ago, and I myself am still getting used to the new layout and the new functionality.
I must admit, the new U/I looks pretty good! More often than not, we find U/I redesigns to be a bit of a nightmare. I mean you get so used to doing things a certain way, then all of a sudden everything you know is different and it feels like you have to re-learn everything that you were comfortable with.
In this latest addition, Google really seems to have taken some good steps to actually make things easier for new users, and also not make them so frustrating for already established users.
That being said, I used to have a really horrible habit in Google Analytics where I would be doing some marketing deep dive stuff, and I would find a really great report combination that would give me the exact data I was looking for, and then I wouldn’t really note how I got there…Was actually pretty stupid, as when I would then need that data again in the next day, week, or month, I would of course forget where I had found the exact configuration, then I would proceed to waste a bunch of time trying to re-create my masterpiece.
As you can imagine, this wastes time unnecessarily, and time is something no member of an early stage startup can afford to lose.
Shortcuts to save the day
One day I decided I wanted to stop wasting time like this, and I discovered this beautiful, unpronounced button in the GA interface labeled ”shortcut.” Low and behold, the button gives you the option to do exactly what it says - Save the report in a section of analytics where you can easily pull it up again later.
Let’s look at report in action here, and talk about how you can implement this strategy into your own GA implementation.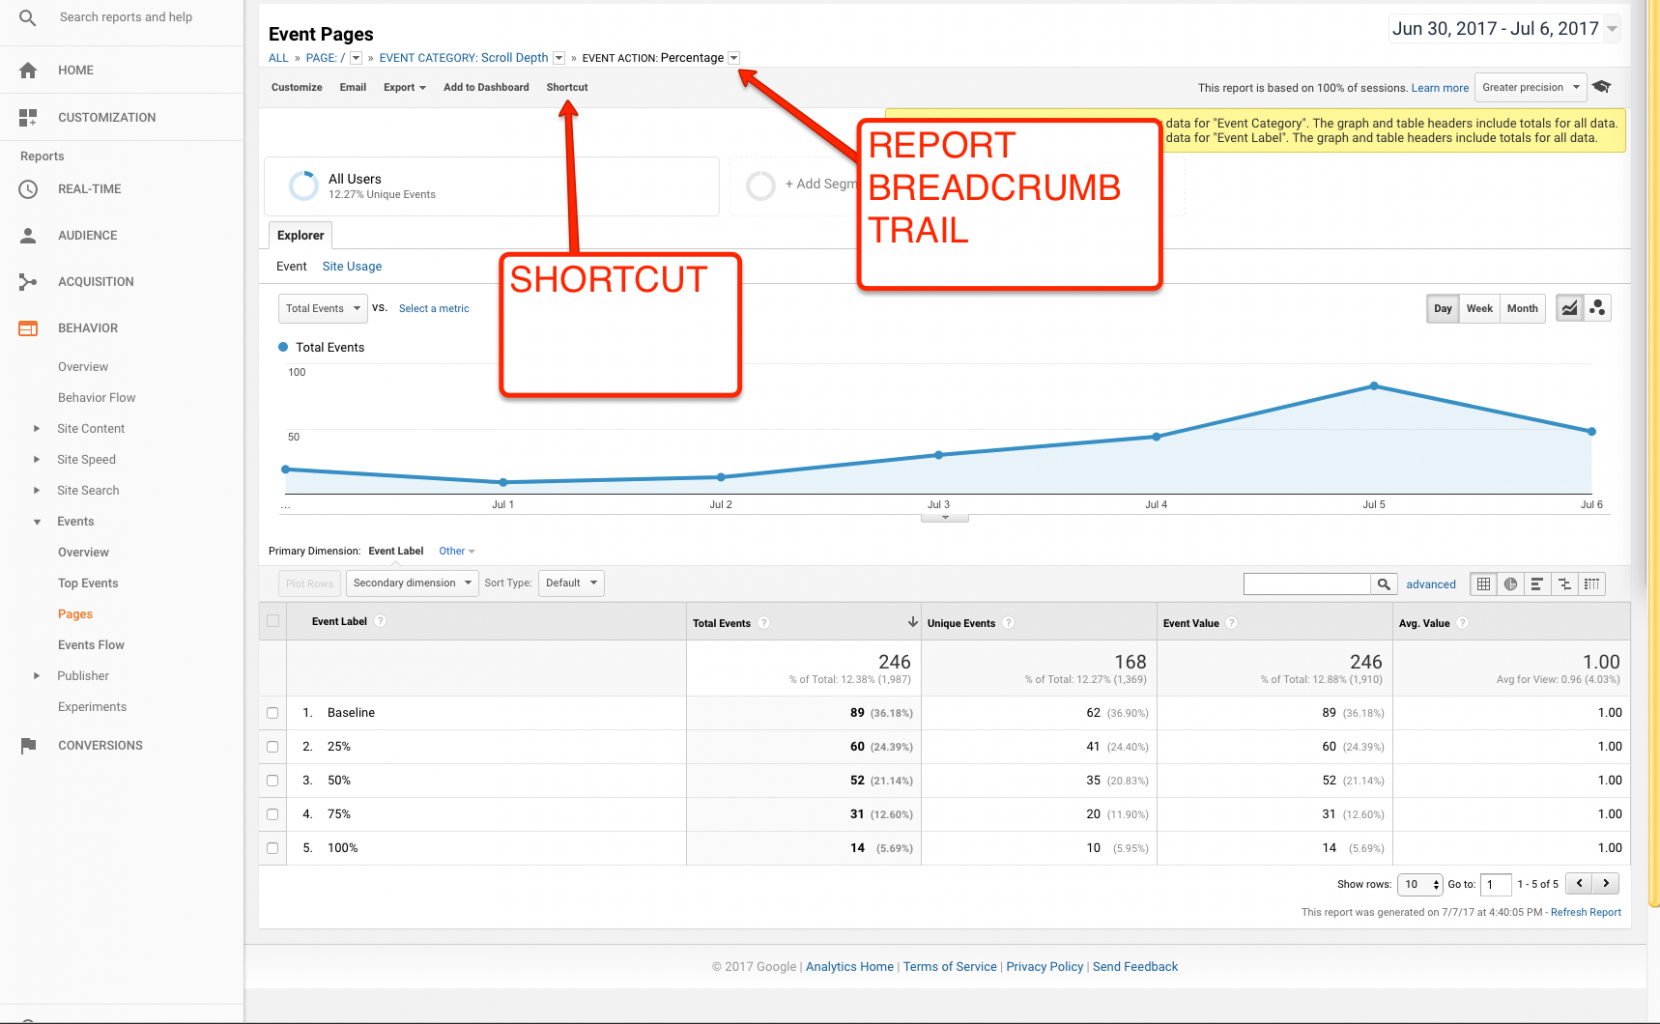
Here is a screen shot of a report I frequently visit in all GA implementations I work with, the event report for tracking scroll tracking.
My goal in this article is not to get too in the mechanics of what scroll tracking is, rather to show you how to shortcut a not-so-easy-to-find report, but in a nutshell this report allows me to see what percent of a page is being seen. So normally, to navigate to this page I have to:
- Click on behavior in the left column
- Expand the Events section on the left
- Choose Pages from the expanded selection
- Select my specific URL in the list that appears
- Select my specific Event Category
- Click on the Event Action that shows up in the next list
And BAM! Now I’m at my report! But…seriously, 6 steps with a bunch of labels and buttons of stuff that all seems similar to each other and sound basically the same?
There’s no way you’re remembering this exact order the next time you’ve got to get to this report, especially if you’re just starting out with your time in Google Analytics.
"When you get to something you like in Google Analytics, Shortcut it!"
So the rule of the thumb is, when you get to something you like in Google Analytics, Shortcut it! In the screenshot above simply find that button and click it. You’ll be prompted to give your report a name (please make it something easy and relevant to identify, choosing something like “Report 1” is just as bad of an idea as not using shortcuts at all) and then your reports will show up in CUSTOMIZATION>SHORTCUTS and they’ll be ready to go with one simple click in the future!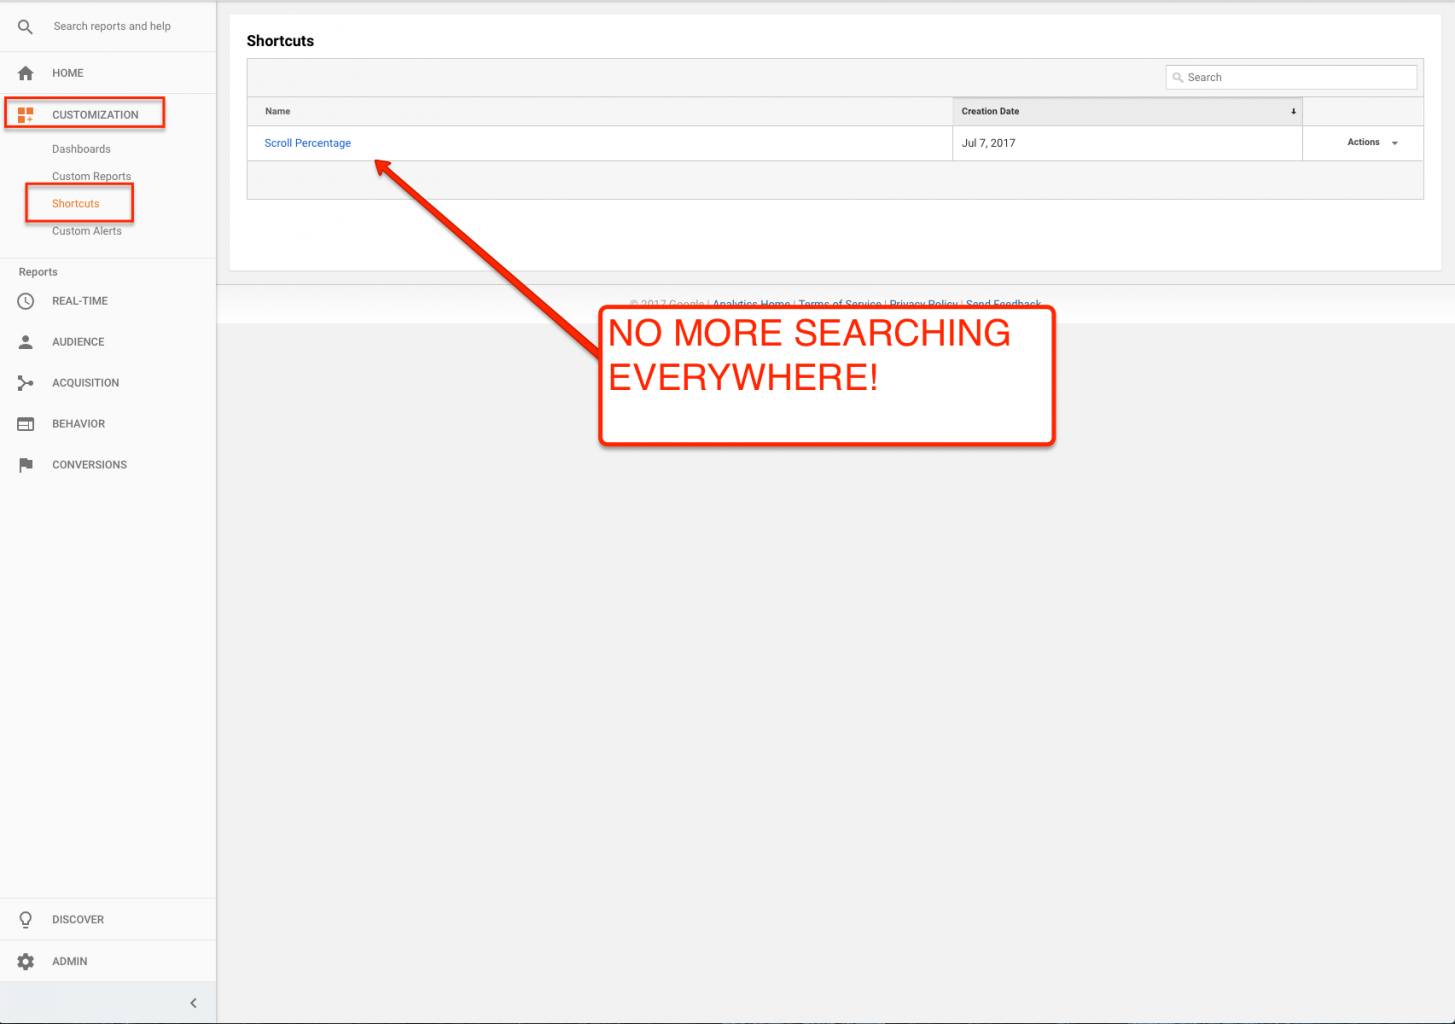
Do you sometimes look at your data and think WTF? You might have some errors in your Google Analytics Setup! :(
By now, for those of you who have been dabbling in analytics for quite some time now, may begin to realize that some things just aren’t making sense. To be frank, Google Analytics will probably not make 100% sense all of the time. Ever.
That’s just the nature of the beast. Take me for example, I spend a lot of my working hours inside of analytics for both the SpinLab account, and many of the accounts of our startups. There is a good chunk of functionality that I know how to leverage extremely well, and I pass this on to our startups when I work with them.
However, there is a good chunk of Google Analytics I don’t venture off into very often for various reasons, and in these areas I’m still very much just like…what? But that’s the truth for most web tools these days, they evolve quickly, and users tend to find their niche within.
That being said, there are some times when things just don’t line up. You may find yourself running into situations and questions such as:
- I just saw this number in another report, why is it completely different here?
- There’s really no reason for this spike of data here.
- This was installed properly yesterday, why is it broken today?
- Where did my campaign data go? Or Why is my campaign data falling into the wrong source area?
- And so on and so forth.
What should you do when you are having issues you can’t solve?
Simple, consult the kissmetrics blog article that highlights 29 Common Google Analytics Data Errors And How to Fix Them.
Like the rest of the blog articles in this series, I’m not going to reinvent the wheel, because kissmetrics has already done an outstanding job of creating it for us.
Rather, I want to make startups aware of these issues, before they become to big. Basically I want you to find this guide and become aware of it, before problems in Google Analytics find you…and in the worst case cost you losing customers and / or revenue.
What is awesome about this guide?
- It’s self teaching Whoa. I know that sounds a little weird, but the fact that they’ve laid this out in a 29 situation layout is awesome. You may visit this site when you actually have problem number 21. That means you’ll likely have to scroll through problems 1-20. Every time this happens you’re brain is going to subconsciously start to hold some of those now irrelevant problems for future use. So when you run into weirdness later, not only will know exactly where to go to address it, you’ll already have a basic idea of how to address it. Ok, maybe that STILL sounds weird, but I have caught this happening to myself every now and then.
- It’s example based. Every problem isn’t just going through a bunch of technical mumbo jumbo. It walks you through a bunch of real world examples to best illustrate each problem, and its possible consequences.
- It’s well laid out and concise. User experience is a big deal for me, and this article satisfies that desire for me fairly well. The article is well laid out, easy to read, and has a bunch of great screenshots to show you exactly where to be clicking.
- It touches on tag manager basics. Everyone I work with knows I’m a big advocate of Google Tag Manager, and this article touches on some basics with that, when it comes to GTM talking to Google Analytics properly.
So what problems are you having with Google Analytics?
So now that you know what problems may be awaiting for you in your current or future Google Analytics implementations, what questions or problems do you still have left over? If you'd have some great success with fixing crazy errors, let us know in the comments. I'm always up to discuss some nerdy analytics stuff!
Scroll tracking + Google Analytics = <3
If your startup is already equipped to use Google Tag Manager, this is a must have integration you should build into your setup. Scroll tracking basically allows you to track, in analytics, how much of each page your visitors are actually viewing.
Why is it important? Because you need to make sure the crucial items on your page are actually getting seen.
"Why is it important? Because you need to make sure the crucial items on your page are actually getting seen."
After all, what use is that checkout button at the bottom of your page if only 2% of your visitors actually get all the way to the bottom of the page? Scroll tracking will give you this extra layer of information.
So how do we do it?
Like the rest of this mini series of articles, I’m not about redoing great working that has already been done. Matthew Kay from Advanced Web Ranking has already written a killer article on this, and this is the exact resource I give to our startups here when I tell them to implement this.
His setup will allow you to get recordings on people that reach baseline (basically loading the page), 25%, 50%, 75% and 100%. You can then base your optimizations around these percentages.
In addition to seeing the added information, you can also use these percentages to perform certain actions on your website with your Google Tag Manager integration. Let’s take a look at this in detail:![]()
If you visit any of our webpages that have the word “blog” in the URL, you’ll quickly notice that this nice little social media sharing icons pops up as you scroll down the page.
That’s because I’ve told Google Tag Manager to fire that Tag when a user lands on a URL with the world blog, and reaches the 25% mark. This type of logic becomes possible when you’re tracking scroll percentages! The nice little pop at 25% gives the user a nice little added element as they’re reading the article, something to interact with them so to say.
It doesn’t end with that either, there’s a myriad of different actions you can have performed on the site when you’re using scroll tracking. Since I’ve started doing this, it’s really opened up a whole other world of possibilities for me.
So how are you getting on with Google Analytics?
After all these mini-articles, what processes are you still lacking with your startup? What would you still like to see done? Let us know in the comments below, and we’ll be glad to help you dig into your situation. Please revisit this blog frequently as we will be adding new content to it as we go!


/White%20Versions/stadt_leipzig_white.png?width=130&name=stadt_leipzig_white.png)
/lfca_white.png?width=119&name=lfca_white.png)

/White%20Versions/sachsen_signet_white.png?width=65&height=79&name=sachsen_signet_white.png)