

Dear reader please note this is NOT a regular product market fit blog article. Here we neither explain you what Product Market Fit is (we already did in our Product Marktet fit and your startup: 7 things you need to know blog nor will we repeat you that a bad product market fit is the reason #1 why startups fail. With this article we want to introduce you to a methodology to quantify your product market fit.
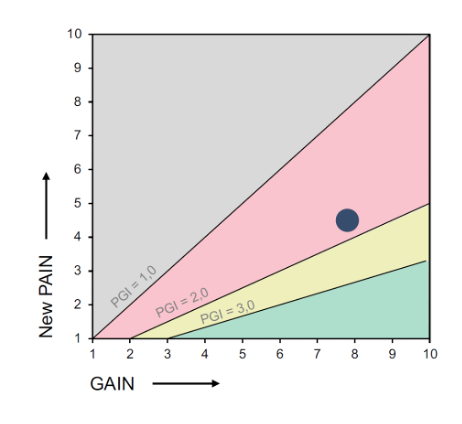
Yes, we know you have wondered along your startup journey how to actually measure if you are doing a good job regarding your PMF and that is why we bring you the UScale’s PMF-Development-Framework. This quantitative approach will help you figure out if you have a high, medium, low or no PMF at all, and it will give you the possibility to illustrate the result in a Cartesian plane like the following:
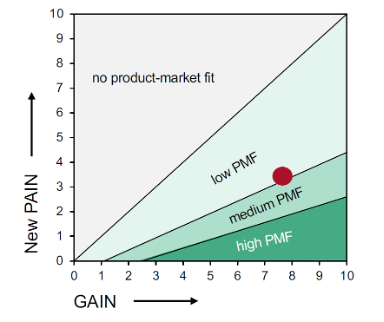
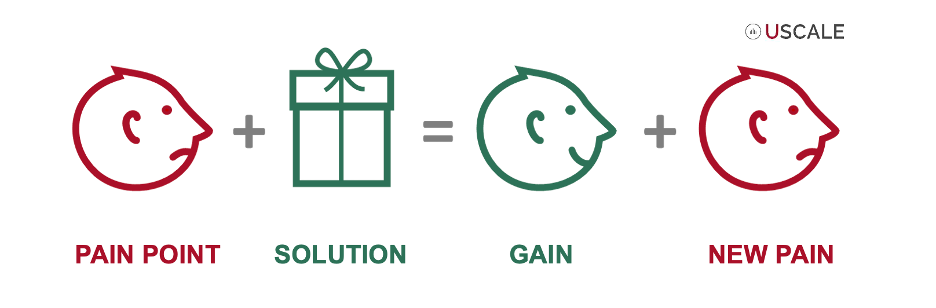
Interesting, isn’t it? This whole method is based on a premise all startups should be aware of: Innovations solve PAIN, but always create NEW PAIN. Thus, the product-market fit can not only be assessed by the value proposition itself (gains created), but results from a ration of Gains to new Pains.
UScale’s approach is based on findings of i.a. Gourville (2006). Gourville (2006) demonstrates the so-called blind spot of entrepreneurs that concerns the perceived losses of adopting to a new innovation. Check out some of his mentioned examples in the following table and see how easy it is to understand.

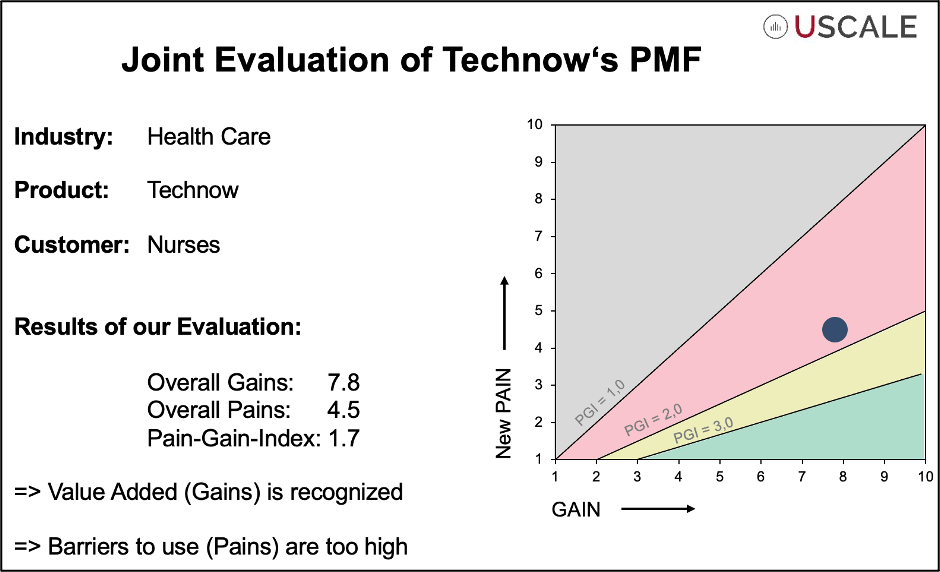
Having this clear, we at Spinlab quantified the PMF of one of our current startups during the “Quantity my Product Market fit” workshop led by our mentor Dr. Helen Mengis who is part of the UScale team. For this blog purpose the assessed startup’s name will be Technow.
What do you need to quantify your PMF?
- Choose the product you want to calculate the PMF for.
- Invite current customers or potential customers who can provide you with user insights on your innovation/ product to a 1-hour session.
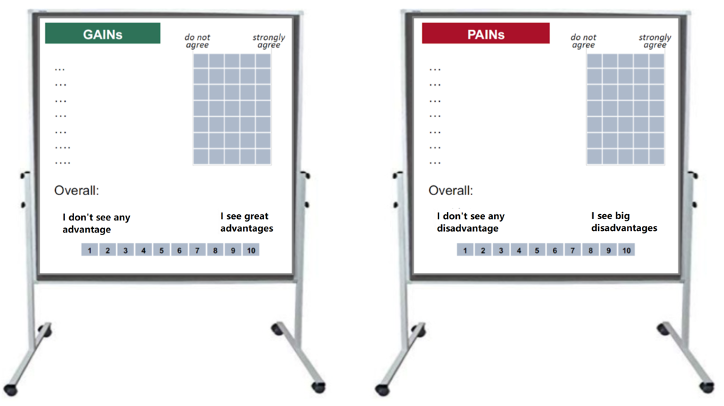
- Two flip chart’s papers with the following template:
Now you're ready to start the journey of quantifying your product market fit and we will describe to you the steps you need to follow to perform the calculations.
1. Pitch your idea in one minute to the audience so they know what product you are talking about.
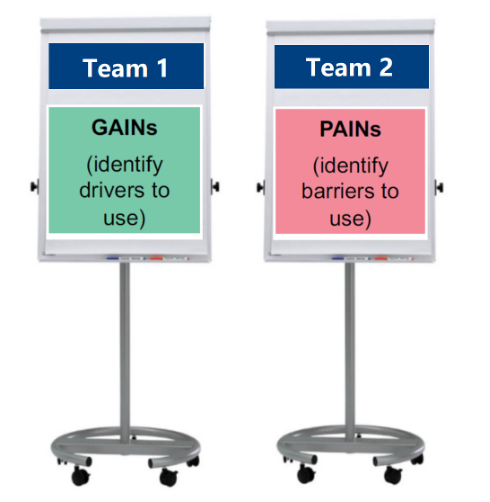
2. Divide the audience into two groups. The first group will have the task of discussing and listing the gains of your product and the second should focus their attention on the new pains. For this activity, groups will have 20 minutes discussion.
Be aware: During this step you will have the opportunity to hear the opinions of your customers about gains and new pains related to the innovation you are offering to them. Listen, listen, listen is what you have to do during these insightful minutes.
3. The audience of customers come together and both teams will explain the gains and new pains that were listed. It is important that every person in the audience gets clarity of every listed gain and new pain.
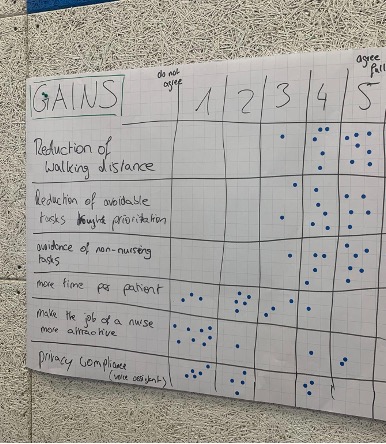
4. Now it is turn to hand over every person in the audience some dot stickers and ask them to rate in a scale from 1 to 5 if they do totally agree (rating with a 5) or do not agree at all (rating with a 1) with the listed gains. People will have to answer the question: Do you agree that this is a gain of the product of the Technow?
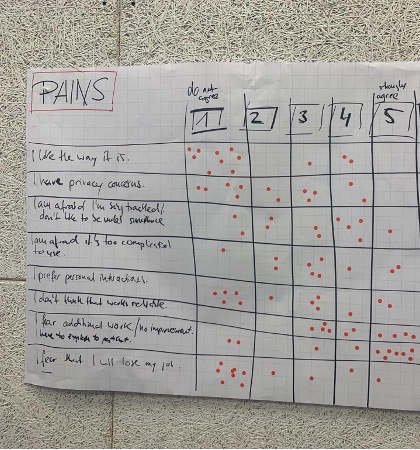
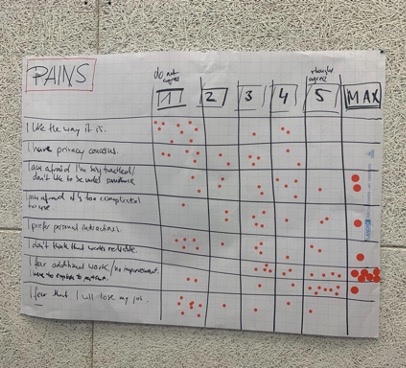
5. After rating the gains, it is time to do the same for the new pains. Every person has to rate on a scale from 1 to 5 if they totally agree (rating with a 5) or do not agree at all (rating with a 1) that those are new pains of the Technow product. In this case the question to answer would be: Do you agree that this is a new pain of the Technow product?
6. With bigger sticker dots, it is time to ask every person to point out what they consider is the biggest gain and the biggest new pain of Technow's product. Every person selects one gain and one pain and paste the dots in the MAX columns.

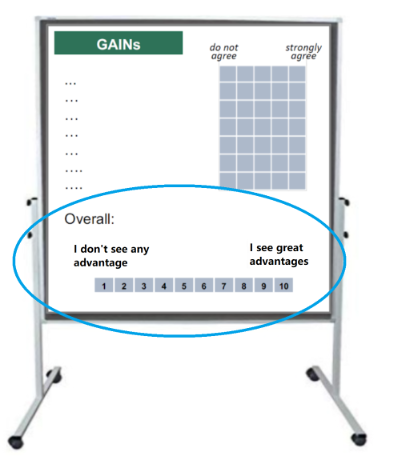
7. Now it is time for the Gains overall assessment. Every person has to answer the following question: All in all, how do you personally rate the advantages of using Technow? The average of the answers for Technow's product was 7.8.
8. Next step is the assessment of the pains asking every person to answer the following question: All in all, how do you personally rate the disadvantages of using Technow? The average of the answers for the Technow’s product was 4.5
9. With both values from the points 7 and 8 we can calculate the ratio which is the Technow’s quantified PMF: 7.8/4.5 = 1.73 .This 1.73 result locates Technow’s product market fit in the red area or “low product market fit” area.
The best is yet to come, keep reading!! The UScale methodology is not only very useful and disruptive for quantifying your product market fit but could also be used for driver and barriers proposals, customer segmentation or USP prioritization, Proof-of-Concept for two Product Alternatives -before market launch. For more information, feel free to contact Helen: helen.mengis@uscale.digital.
Article written in collaboration with Helen Mengis - UScale Employee.


/White%20Versions/stadt_leipzig_white.png?width=130&name=stadt_leipzig_white.png)
/lfca_white.png?width=119&name=lfca_white.png)

/White%20Versions/sachsen_signet_white.png?width=65&height=79&name=sachsen_signet_white.png)